Upload Your Images
(or try our example images)
Due to server limitations, image size is limited to 5MB per image
Extraction & Pre-processing
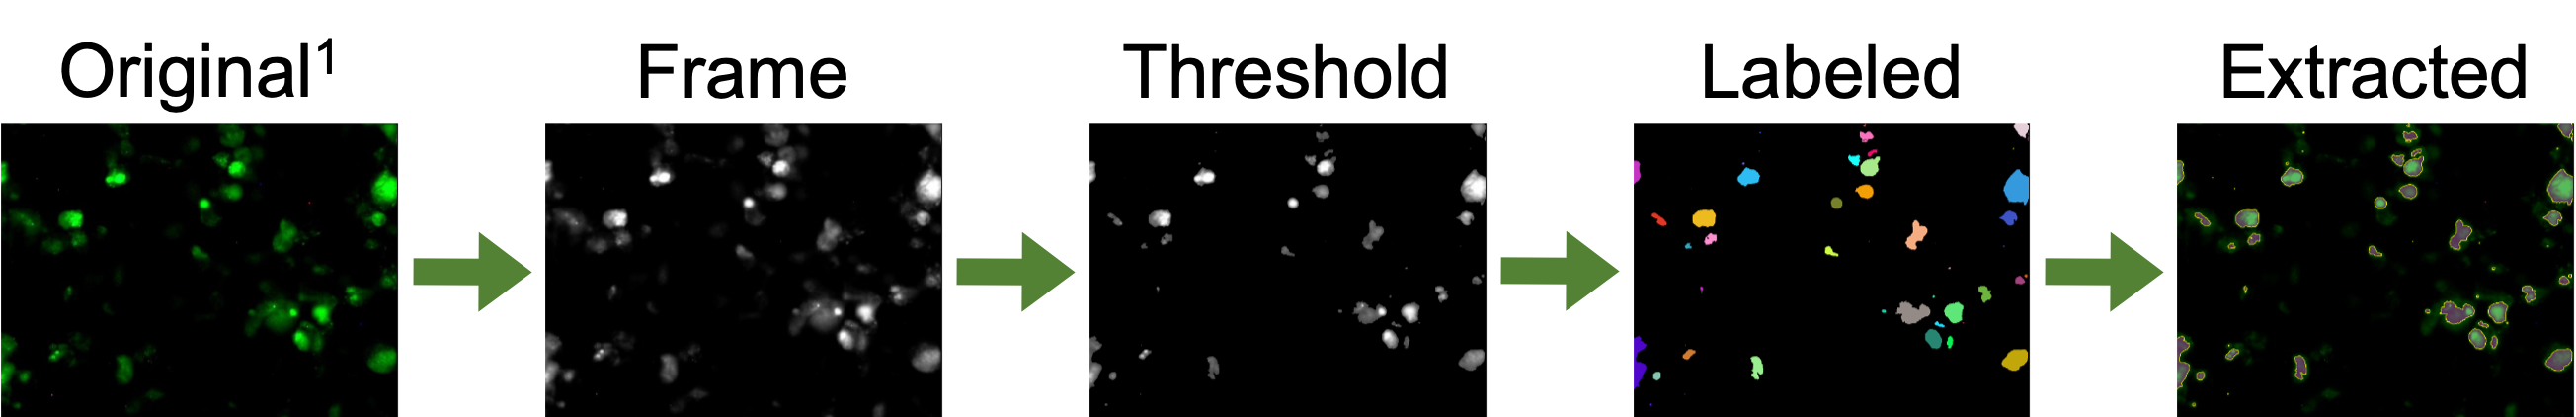
1Messerli SM, Hoffman MM, Gnimpieba EZ, Bhardwaj RD. Therapeutic targeting of ptk7 is cytotoxic in atypical teratoid rhabdoid tumors. Molecular Cancer Research: MCR. 2017;15(8):973-983. doi:10.1158/1541-7786.MCR-16-0432.
View Results
The Bioinformatic Analysis, Statistic, and Image Comparison (BASIN) app extracts object feature data and statistics from fluorescent micrographs.
The user uploads images plus a custom analysis table which contains image and experiment information.
The user then chooses the desired threshold method for each color frame and runs the analyses for each image.
BASIN runs the analyses and returns graphs and t-test results which the user may then incorporate in his or her paper.
The analysis parameters and results may also be published in OntoBIDS.
(biocondition 1)
(biocondition 2)
Net Intensity and Object Count Differences
Package Citations
[1] Yihui Xie, Joe Cheng and Xianying Tan (2019). DT: A Wrapper of the JavaScript Library 'DataTables'. R package version 0.7. https://CRAN.R-project.org/package=DT
[2] Gregoire Pau, Florian Fuchs, Oleg Sklyar, Michael Boutros, and Wolfgang Huber (2010): EBImage - an R package for image processing with applications to cellular phenotypes. Bioinformatics, 26(7), pp. 979-981, 10.1093/bioinformatics/btq046
[3] H. Wickham. ggplot2: Elegant Graphics for Data Analysis. Springer-Verlag New York, 2016.
[4] Alboukadel Kassambara (2019). ggpubr: 'ggplot2' Based Publication Ready Plots. R package version 0.2.1. https://CRAN.R-project.org/package=ggpubr
[5] Hadley Wickham (2011). The Split-Apply-Combine Strategy for Data Analysis. Journal of Statistical Software, 40(1), 1-29. URL http://www.jstatsoft.org/v40/i01/.
[6] Winston Chang, Joe Cheng, JJ Allaire, Yihui Xie and Jonathan McPherson (2019). shiny: Web Application Framework for R. R package version 1.3.2. https://CRAN.R-project.org/package=shiny
[7] Eric Bailey (2015). shinyBS: Twitter Bootstrap Components for Shiny. R package version 0.61. https://CRAN.R-project.org/package=shinyBS
[8] Andras Sali (2017). shinycssloaders: Add CSS Loading Animations to 'shiny' Outputs. R package version 0.2.0. https://CRAN.R-project.org/package=shinycssloaders
[9] Winston Chang and Barbara Borges Ribeiro (2018). shinydashboard: Create Dashboards with 'Shiny'. R package version 0.7.1. https://CRAN.R-project.org/package=shinydashboard
[10] Winston Chang (2018). shinythemes: Themes for Shiny. R package version 1.1.2. https://CRAN.R-project.org/package=shinythemes
[11] Victor Perrier, Fanny Meyer and David Granjon (2019). shinyWidgets: Custom Inputs Widgets for Shiny. R package version 0.4.9. https://CRAN.R-project.org/package=shinyWidgets
[12] Gagolewski M. and others (2019). R package stringi: Character string processing facilities. http://www.gagolewski.com/software/stringi/.
[13] Hadley Wickham (2007). Reshaping Data with the reshape Package. Journal of Statistical Software, 21(12), 1-20. URL http://www.jstatsoft.org/v21/i12/.
[14] R Core Team (2019). R: A language and environment for statistical computing. R Foundation for Statistical Computing, Vienna, Austria. URL https://www.R-project.org/.
[15] Baptiste Auguie (2017). gridExtra: Miscellaneous Functions for 'Grid' Graphics. R package version 2.3. https://CRAN.R-project.org/package=gridExtra
Report Results
Note that it may take up to a few minutes to generate the full report, depending on the total number of images uploaded.